首先我用customplot的时候需要先知道它内部类的使用方式和作用,比如以下的图像部分:
QCPGraph :折线图
QCPCurve:用于曲线图,可以有循环
QCPBars:柱形图,如果有多个QCPBars ,可以依次重叠
QCPStatisticalBox(需实例化):盒子图
QCPColorMap(实例化):色谱图
QCPFinancial(实例化):金融图
QCPAbstractItem:标示项
包括:
QCPItemStraightLine:直线
QCPItemLine:线段
QCPItemCurve:曲线
QCPItemRect:矩形
QCPItemEllipse:椭圆
QCPItemText:文本
QCPItemTracer:小圆球
QCPItemPixmap:图片
QCPItemBracket:括弧布局项(QCPLayoutElement):布局项(QCPAbstractLegendItem)、坐标轴矩形(QCPAxisRect)
网格线(QCPGrid):每一个坐标轴对应一个网格线
坐标轴(QCPAxis):一个坐标轴矩形包含四个坐标轴,上下左右四个坐标轴。简易demo:
void MainWindow::setupSimpleDemo(QCustomPlot *customPlot) { demoName = “Simple Demo”; // add two new graphs and set their look: customPlot->addGraph(); customPlot->graph(0)->setPen(QPen(Qt::blue)); // line color blue for first graph customPlot->graph(0)->setBrush(QBrush(QColor(0, 0, 255, 20))); // first graph will be filled with translucent blue customPlot->addGraph(); customPlot->graph(1)->setPen(QPen(Qt::red)); // line color red for second graph // generate some points of data (y0 for first, y1 for second graph): QVector<double> x(250), y0(250), y1(250); for (int i=0; i<250; ++i) { x[i] = i; y0[i] = qExp(-i/150.0)*qCos(i/10.0); // exponentially decaying cosine y1[i] = qExp(-i/150.0); // exponential envelope } customPlot->xAxis->setRange(0, 250); customPlot->xAxis->setAutoTickStep(false); customPlot->xAxis->setTickStep(25); customPlot->xAxis->setAutoSubTicks(false); customPlot->xAxis->setSubTickCount(9); customPlot->yAxis->setRange(0, 10); // configure right and top axis to show ticks but no labels: // (see QCPAxisRect::setupFullAxesBox for a quicker method to do this) customPlot->xAxis2->setVisible(true); customPlot->xAxis2->setTickLabels(false); customPlot->yAxis2->setVisible(true); customPlot->yAxis2->setTickLabels(false); // make left and bottom axes always transfer their ranges to right and top axes: connect(customPlot->xAxis, SIGNAL(rangeChanged(QCPRange)), customPlot->xAxis2, SLOT(setRange(QCPRange))); connect(customPlot->yAxis, SIGNAL(rangeChanged(QCPRange)), customPlot->yAxis2, SLOT(setRange(QCPRange))); // pass data points to graphs: customPlot->graph(0)->setData(x, y0); customPlot->graph(1)->setData(x, y1); // let the ranges scale themselves so graph 0 fits perfectly in the visible area: customPlot->graph(0)->rescaleAxes(); // same thing for graph 1, but only enlarge ranges (in case graph 1 is smaller than graph 0): customPlot->graph(1)->rescaleAxes(true); // Note: we could have also just called customPlot->rescaleAxes(); instead // Allow user to drag axis ranges with mouse, zoom with mouse wheel and select graphs by clicking: customPlot->setInteractions(QCP::iRangeDrag | QCP::iRangeZoom | QCP::iSelectPlottables); }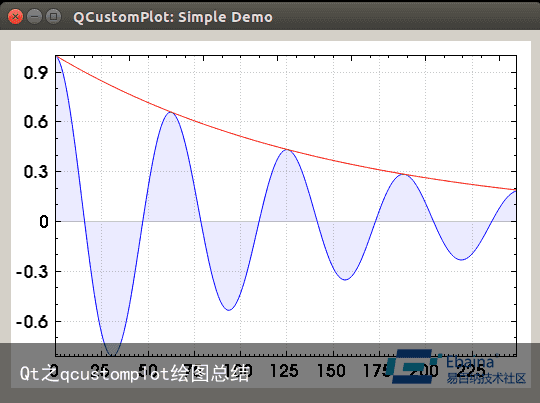
免责声明:文章内容来自互联网,本站不对其真实性负责,也不承担任何法律责任,如有侵权等情况,请与本站联系删除。
转载请注明出处:Qt之qcustomplot绘图总结 https://www.yhzz.com.cn/a/16014.html